Global Hunger Index (GHI) 2022 (GS Paper 3, Economy)

Why in news?
- India ranks 107 out of 121 countries on the Global Hunger Index in which it fares worse than all countries in South Asia barring war-torn Afghanistan.
What is India’s score relative to those of the others?
- With a score of 29.1, which falls in the ‘serious’ category of hunger, India was ranked behind its neighboursNepal (81), Pakistan (99), Sri Lanka (64), and Bangladesh (84).
- Afghanistan (109) is the only country in South Asia that performs worse than India on the index.
- India has been recording decreasing GHI scores over the years. In 2000, it recorded an ‘alarming’ score of 38.8, which reduced to 28.2 by 2014. The country has started recording higher scores since then.
- While India has been consistently recording lower values for the four indicators, it started going up in 2014 for undernourishment and the prevalence of wasting in children.
- The proportion of undernourishment in the population went from 14.8 in 2014 to 16.3 in 2022, and the prevalence of wasting in children under five years jumped from 15.1 in 2014 to 19.3 in 2022.
India’s performance:
- India’s child wasting rate (low weight for height), at 19.3%, is worse than the levels recorded in 2014 (15.1%) and even 2000 (17.15%), and is the highest for any country in the world and drives up the region’s average owing to India’s large population.
- Prevalence of undernourishment, which is a measure of the proportion of the population facing chronic deficiency of dietary energy intake, has also risen in the country from 14.6% in 2018-2020 to 16.3% in 2019-2021. This translates into 224.3 million people in India considered undernourished out of the total 828 million people undernourished globally.
- India has shown improvement in the other two indicators - child stunting has declined from 38.7% to 35.5% between 2014 and 2022 and child mortality has also dropped from 4.6% to 3.3% in the same comparative period.
- On the whole, India has shown a slight worsening with its GHI score increasing from 28.2 in 2014 to 29.1 in 2022. Though the GHI is an annual report, the rankings are not comparable across different years. The GHI score for 2022 can only be compared with scores for 2000, 2007 and 2014.
Global scenario:
- Globally, progress against hunger has largely stagnated in recent years. The 2022 GHI score for the world is considered “moderate”, but 18.2 in 2022 is only a slight improvement from 19.1 in 2014.
- This is due to overlapping crises such as conflict, climate change, the economic fallout of the COVID-19 pandemic as well as the Ukraine war, which has increased global food, fuel, and fertiliser prices and is expected to “worsen hunger in 2023 and beyond.”
- There are 44 countries that currently have “serious” or “alarming” hunger levels and “without a major shift, neither the world as a whole nor approximately 46 countries are projected to achieve even low hunger as measured by the GHI by 2030.
- Yemen has ranked in the lowest position at 121, while the top of the list is dominated by European nations including Croatia, Estonia and Montenegro. Among Asian nations, China and Kuwait have ranked the highest.
- China is among the countries collectively ranked between 1 and 17 having a score of less than five.
What is Global Hunger Index (GHI)?
- The Global Hunger Index (GHI) is a tool for comprehensively measuring and tracking hunger at global, regional, and national levels.
- Jointly published by Concern Worldwide and Welthungerlife, the GHI lists countries by ‘severity’.
- The GHI has been brought out almost every year since 2000; with 2022 report being the 15th one. A low score gets a country a higher ranking and implies a better performance.
- The reason for mapping hunger is to ensure that the world achieves “Zero Hunger by 2030”, one of the Sustainable Development Goals laid out by the United Nations. It is for this reason that GHI scores are not calculated for certain high-income countries.
- GHI scores are based on the values of four component indicators - undernourishment, child stunting, child wasting and child mortality.
- The GHI score is calculated on a 100-point scale reflecting the severity of hunger, where zero is the best score (no hunger) and 100 is the worst.
How is hunger measured?
Four main indicators:
- Undernourishment (which reflects inadequate food availability): calculated by the share of the population that is undernourished (that is, whose caloric intake is insufficient);
- Child Wasting (which reflects acute undernutrition): calculated by the share of children under the age of five who are wasted (that is, those who have low weight for their height);
- Child Stunting (which reflects chronic undernutrition): calculated by the share of children under the age of five who are stunted (that is, those who have low height for their age);
- Child Mortality (which reflects both inadequate nutrition and unhealthy environment): calculated by the mortality rate of children under the age of five (in part, a reflection of the fatal mix of inadequate nutrition.
- Each country’s data are standardised on a 100-point scale and a final score is calculated after giving 33.33% weight each to components 1 and 4, and giving 16.66% weight each to components 2 and 3.
- Countries scoring less than or equal to 9.9 are slotted in the “low” category of hunger, while those scoring between 20 and 34.9 are in the “serious” category and those scoring above 50 are in the “extremely alarming” category.
Role of the woman livestock farmer
(GS Paper 1, Social Issues)
Context:
- On the International Day of Rural Women (October 15), there is need to recognise the role of women in livestock rearing, and to include women in all facets of livestock development, be it breeding, veterinary care, extension services, training or access to credit and markets.
Potential of livestock sector:
- The livestock sector is one of the most rapidly growing components of the rural economy of India, accounting for 5% of national income and 28% of agricultural GDP in 2018-19.
- In the last six years, the livestock sector grew at 7.9% (at constant prices) while crop farming grew by 2%.
- The field studies show that in rural households that own livestock, women are invariably engaged in animal rearing.

Women in livestock sector:
- It is widely recognised that the majority of women workers in rural areas (72%) are engaged in agricultural activities. However, with the exception of participation in dairy co-operatives, specifically in milk marketing, women’s role in the livestock economy is not as widely known or discussed.
- There were five million women members in dairy co-operatives in 2015-16, and this increased further to 5.4 million in 2020-21. Women accounted for 31% of all members of dairy producer cooperatives in 2020-21.
- In India, the number of women’s dairy cooperative societies rose from 18,954 in 2012 to 32,092 in 2015-16.
Issues with data collection:
- Conventional labour force surveys fail to accurately record women’s work in livestock-raising for many reasons.
- Among the many problems in data collection, two significant ones are the sporadic nature of work undertaken for short spells throughout the day and often carried out within the homestead, and women’ own responses.
- One way to adjust official statistics for this error is by calculating an augmented work participation rate. In addition to women reporting themselves as engaged in economic activity, this estimate includes women who reported themselves as “engaged in domestic duty” or care work for the major part of the year but spent time on specific activities such as kitchen gardening, household dairy/poultry, paddy husking, etc.
An underestimation
Augmented work participation rate:
- To illustrate, 12 million rural women were workers in livestock-raising, an estimate based on the Employment and Unemployment Survey of 2011-12. However, with the augmented definition, around 49 million rural women were engaged in livestock raising.
- The women actually engaged in the livestock economy were four times the official estimate and a sizeable section of the rural population.
- Statistics from India’s first national Time Use Survey in 2019 corroborate this finding. By recording all activities done in the past 24 hours (be it cooking or working in the fields), 11% of rural women or 48 million women were engaged in animal rearing.
National Livestock Policy (NLP) of 2013:
- The National Livestock Policy (NLP) of 2013, aimed at increasing livestock production and productivity in a sustainable manner, rightly states that around 70% of the labour for the livestock sector comes from women.
- One of the goals of this policy was the empowerment of women.
National Livestock Mission (NLM):
- The National Livestock Mission (NLM) of 2014-15 was initiated for the development of the livestock sector with a focus on the availability of feed and fodder, providing extension services, and improved flow of credit to livestock farmers.
- However, the NLM does not propose any schemes or programmes specific to women livestock farmers. The policy proposes that the State government allocates 30% of funds from centrally-sponsored schemes for women. There is no logic for the 30% quota.
Core problems:
- The problem clearly is that women livestock farmers are not visible to policymakers, and one reason is the lack of gender-disaggregated data.
- First, recent employment surveys such as the Periodic Labour Force Survey fail to collect data on specific activities of persons engaged primarily in domestic duties. So, the undercounting of women in the livestock economy continues.
- Second, the reach of extension services to women livestock farmers remains scarce.Only a few women in each village reported receiving any information from extension workers. Women wanted information but wanted it nearer home and at times when they were free.
- Third, women in poor households, without collateral to offer to banks, found it difficult to avail loans to purchase livestock. Around 15 lakh new Kisan Credit Cards (KCC) were provided to livestock farmers under the KCC scheme during 2020-22. There is no information on how many of them were women farmers.
- Fourth, women livestock farmers lacked technical knowledge on choice of animals (breeding) and veterinary care. Men invariably performed these specific tasks and took animals for artificial insemination.
- Fifth, women were not aware of the composition and functions of dairy boards and that men exercised decisions even in women-only dairy cooperatives. Further, the voice of women from landless or poor peasant Scheduled Caste households was rarely heard.
Conclusion:
- Women’s labour is critical to the livestock economy. It follows then that women should be included in every stage of decision-making and development of the livestock sector.
- Today, women livestock workers remain invisible on account of their absence in official statistics. This must be corrected.
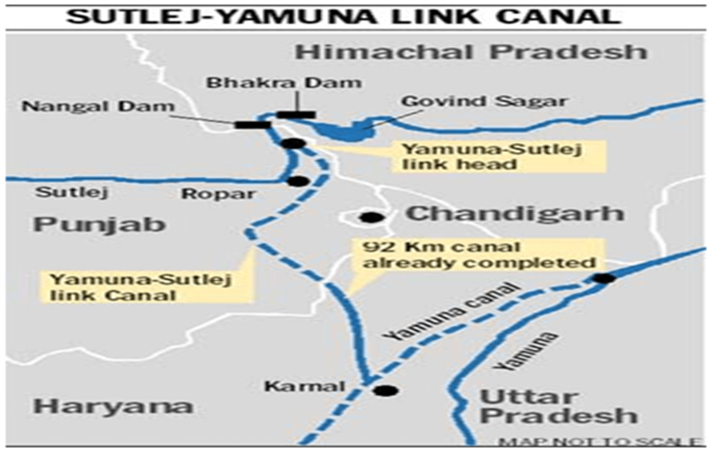
Sutlej-Yamuna Link canal
(GS Paper 2, Governance)
Why in news?
- Recently, the Haryana Chief Minister met his Punjab counterpart in Chandigarh to discuss the Sutlej-Yamuna Link (SYL) canal issue.
- While Haryana wants to restart the construction which stopped in the 1990s, Punjab has said it does not have a drop of water to spare.
- It’s a dispute between Haryana and Punjab that has been going on for more than fifty years.
What is the SYL canal?
- The SYL canal is a proposed 214-kilometre-long canal connecting Sutlej and Yamuna rivers. It was planned in 1966 after the state of Haryana was carved out of Punjab.
- While the decision to share resources was taken, the terms on sharing waters of two rivers, Ravi and Beas, were left undecided.
- Punjab, however, was against sharing waters of the two rivers with neighbouring Haryana, citing riparian principles, which state that the owner of land adjacent to a water body has the right to use the water, besides arguing that it had no water to spare.
What did the Indian government say about water sharing?
- In 1976, a decade after the reorganisation of Punjab, the Centre issued a notification that both states will receive 3.5 million acre-feet (MAF) of water each.
- On 31 December 1981, an agreement was made between Punjab, Haryana and Rajasthan to reallocate the waters of Ravi and Beas in “overall national interest and for optimum utilisation of the waters”. A reassessment was done and the water flowing down Beas and Ravi was estimated at 17.17 MAF. Of this, 4.22 MAF was allocated to Punjab, 3.5 MAF to Haryana, and 8.6 MAF to Rajasthan, by agreement of all three states.
- On 8 April 1982, then-Prime Minister Indira Gandhi launched the construction of the YSL canal in Kapoori village, Patiala district. The canal was to be 214-kilometre long, of which 122 km was to run across Punjab and 92 km across Haryana.
Eradi Tribunal:
- Punjab’s Shiromani Akali Dal (SAD) was not happy and launched a protest against the construction, the KapooriMorcha.
- In July 1985, then-Prime Minister Rajiv Gandhi met then-SAD chief Harchand Singh Longowal and signed an accord, agreeing to a new tribunal to assess the water.
- The Eradi Tribunal was set up, headed by Supreme Court Judge V BalakrishnaEradi. In 1987, it recommended an increase in the shares of Punjab and Haryana to 5 MAF and 3.83 MAF, respectively.
How did militancy in Punjab make matters worse?
- However, Punjab saw a rise in militancy and the construction of the canal became a polarising issue.
- Longowal was killed by militants in August 1985, less than a month after signing the accord. In 1990, chief engineer M L Sekhri and a superintending engineer Avtar Singh Aulakh were also killed by militants. Several labourers working on the project were shot dead.
- In wake of the increasing violence, the construction of the SYL canal was stopped in the 1990s. A large part of it was built, costing over Rs 750 crore.
What has the Supreme Court said?
- In 2002, the Supreme Court (SC) directed Punjab to continue work on the SYL and complete it within a year. The state refused to oblige; instead, it petitioned for a review of the SC order, which was rejected.
- In 2004, following orders from the top court, the Central Public Works Department was appointed to take over the canal work from the Punjab government. However, the state continued to remain defiant.
- The Punjab Legislative Assembly passed the Punjab Termination of Agreements Act of 2004, which abrogated all its river water agreements with neighbouring states. Then-President Dr APJ Abdul Kalam referred this Bill to the Supreme Court to decide on its legality in the same year.
- The case came up for hearing in the top court in 2016. In November of that year, it said that the Punjab Termination of Agreements Act 2004, was illegal.
- However, Punjab decided to denotify 5,376 acres of land that was acquired for the canal and return it to its original owners free of cost.
- In February 2017, the SC stuck to its earlier verdict that the construction of the SYL has to be executed and asked Haryana and Punjab to maintain law and order “at any cost”.
What are Punjab’s complaints?
- According to a study by the state government, many areas in Punjab will go dry by 2029. The state has already over-exploited its groundwater for irrigation purposes as it fills granaries of the Centre by growing wheat and paddy worth Rs 70,000 crore every year.
- Punjab maintains that it is not in a position to share water as the situation is dire.
- In July 2004, the Punjab Assembly enacted the Punjab Termination of Agreement Act, annulling all inter-state agreements signed by the state relating to sharing of Ravi and Beas waters.
What is the demand of Haryana government?
- Haryana believes it has been denied its rightful share of water. It says that providing irrigation is tough for the state. There was a problem with drinking water in southern parts of Haryana, where groundwater has depleted up to 1,700 feet, the newspaper reports.
- In April, Khattar moved a resolution urging the Centre to take measures for the construction of the SYL canal.
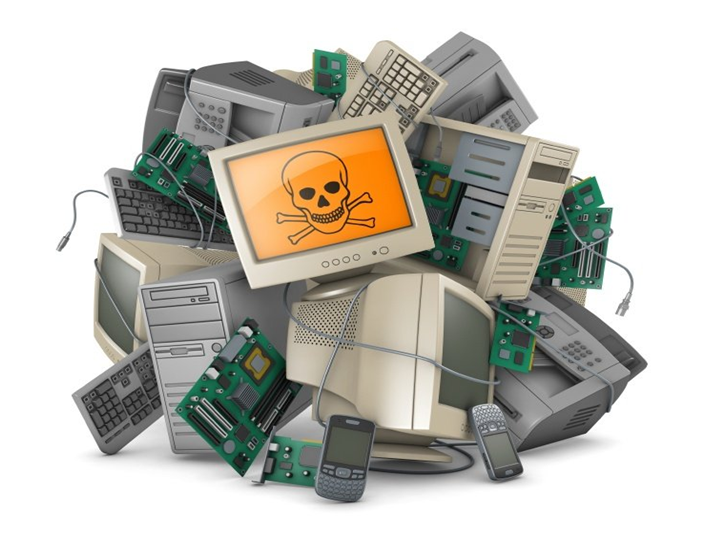
E-Waste Issue
(GS Paper 3, Environment)
Context:
- E-waste management has become a part of many national-level initiatives developed by the Indian government, such as Digital India, Swachh Bharat Mission and Smart Cities Mission.
- The success of these initiatives is also dependent on public awareness of proper e-waste management.. Yet, policymakers are concerned about the proper processing and management of e-waste that will be generated in the coming years.
IEWD:
- According to the recent Global E-waste Monitor Report 2020, India’s e-waste production has increased nearly 2.5 times to 3.23 million metric tonnes in just six years.
- The problem has gained global attention, and as a result, every year on 14 October, the International E-Waste Day (IEWD) is observedto raise awareness of proper e-waste disposal and to promote reuse, recovery, and recycling rates.
- The primary focus of International E-waste Day in 2022 is on the Small Electrical Devices that we no longer use but store in cabinets and drawers or frequently throw in the regular trash.
Menace of small e-waste:
- The challenge of small, obsolete electrical and electronic appliances is extensive. Due to their diminutive size, products like cell phones, electric toothbrushes, toasters, and cameras are frequently thrown away improperly.
- As a result, they account for a sizable portion of the 8% of all e-waste that is thrown in waste bins and is subsequently landfilled or incinerated. As a result, they cannot be extracted and lose the valuable raw materials they contain.
- According to UN estimates, over 22 million tonnes of small e-waste was produced globally in 2019. This amounts to 40% of the 57 million tonnes of electronic waste generated worldwide.
- By 2030, there will be 29 million tonnes of this small item waste if it continues to grow at the same rate as all other e-waste (roughly 3% per year).
Global initiatives:
- The Waste Electrical and Electronic Equipment recycling (WEEE) Forum, a global organisation of e-waste collection schemes, created the day in 2018 with the help of its members.
- The WEEE Forum is an international association representing 46% Producer Responsibility Organisations (PRO’s) across the globe.
Producer Responsibility Organisations (PRO):
- A European idea known as Producer Responsibility Organisations (PRO) transfers the producer’s management of the waste to the PRO.
- A PRO manages the end-to-end operations related to waste management to increase competence, cost-effectiveness, and awareness. In order to ensure environmentally sound management of e-waste, PRO is defined as a professional organisation that has been authorised or financed jointly or separately by producers.
- PRO can assume responsibility for the collection and channelization of e-waste generated from the “end-of-life” of their products. It is because PRO handles collection, transportation, and recycling on behalf of the producers, it plays a critical role.
- The PRO systems adopted by developed countries (like Switzerland, Germany, Austria, Netherlands, and Scandinavian countries) could be the best systems but that doesn’t mean there are no challenges faced by these countries.
- All such countries with best waste management and PRO systems are just able to rigorously adhere to the regulations formulated by their judicial system.
Initiatives in India:
- The idea of PRO is relatively new to the Indian manufacturing industry. According to the latest research, the formal authorisation process for PRO registration began in 2018 in India and the total number of PROs registered by 2021 for e-waste were 51.
- The Central Pollution Control Board (CPCB) has registered 74 PROs and 468 authorised dismantlers as of March 2022, with a total capacity for recycling of about 1.3 million tonnes.
- Recently the Ministry of Environment, Forest & Climate Change (MoEFCC) has released a draft notification on E-Waste (Management) Rules (2022) that eliminates both PROs and dismantlers and transfers more responsibility onto the shoulders of recycling companies (authorised recyclers)—of which India has very few. But the number of e-waste categories has increased from 21 to 95.
Way Forward:
- To tackle the problem there is an emergent need to strengthen the policy in the first place and then comes the implementation with stringent fines. Mass participation of all stakeholders is equally important in this.
- Strengthening the role of Urban Local Bodies in e-waste regulations can help tackle the problem at local level and they should be encouraged to frame their bye-laws to deal with the problem at each ward and zone level.