The Indian Railways revenue problem (GS paper 3, Infrastructure)
Context:
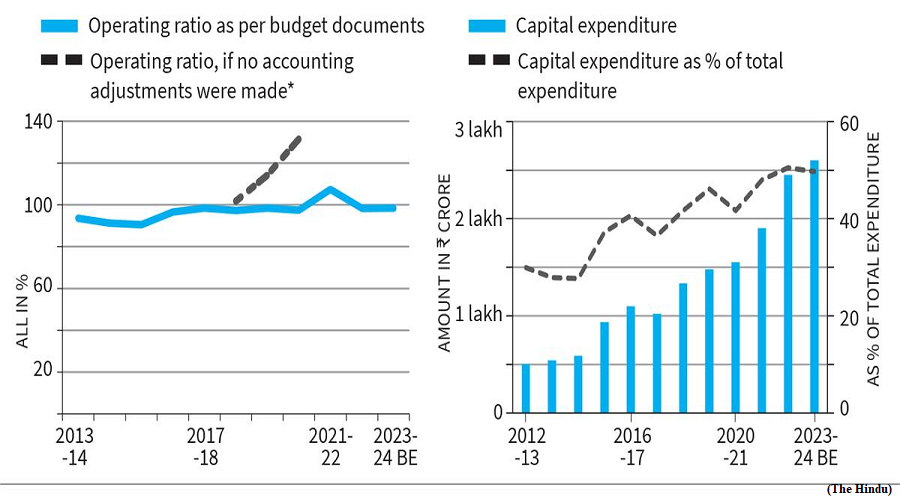
- The Indian Railways (IR) has been on a spending spree with respect to capital expenditure (capex), particularly after the government merged its rail budget with the main budget.
- However, its operating ratio, which is the ratio of ordinary working expenses to the gross traffic receipts, has shown no improvement. A lower ratio implies better profitability and surplus for capital investment.
The trap of rising debt:
- Since the IR continues to have a total lack of surplus, it has been augmenting the funds raised through Gross Budgetary Support (GBS) and Extra Budgetary Resources (EBS). The merging of budgets helped this cause as GBS from the central government could be increased without much scrutiny. However, with respect to EBS, there is a price to pay.
- The IR’s spending on repayment of principal and interest is pegged at ₹22,229 crore and ₹23,782 crore respectively, which together make it 17% of revenue receipts, a sharp rise from less than 10% till 2015-16.
- It appears that this debt liability was noticed as capex relied almost entirely on GBS in 2023 budget. Despite this, the unprecedented rise in capex appears to be predicated on the premise that the IR’s operating and financial performance should not be viewed in isolation but along with its role as an engine for the growth of the country’s economy.
Freight vs. passenger:
- The IR’s freight segment is profitable whereas the passenger segment makes huge losses. The Comptroller and Auditor General of India (CAG) report presented in Parliament states that there was a loss of ₹68,269 crore in all classes of passenger services during 2021-22, with all the profit from freight traffic nullified in cross subsidising passenger services.
- The annual growth in freight volume and revenue of the IR in the period April-July 2023 stand at 1% and 3% respectively, while the economy grows at 7%. This is a dismal performance.
- The IR’s modal share in India’s freight business has steadily decreased to approx. 27% from upwards of 80% at the time of independence.
How the freight business of IR can be improved?
Categorization:
- The movement of cargo by the IR is artificially divided into goods and parcels. The division is not semantic but indicates a paradigmatic difference in approach with respect to tariff rules, handling, moving and monitoring.
- Shippers, however, are not interested in these differences as their concern is mainly about the safe movement of their cargo from point A to B at the least cost and as fast as possible.
- The time has come for the IR to shed such an artificial divide so that cargo can be divided based on its characteristics as bulk and non-bulk (or value added).
Commodities:
- The 11 commodities in the IR’s transport basket account for 90% of tonnage and revenue, of which coal is around 45% and iron ore and cement are around 10% each. Although these three still account for two thirds of the IR’s total freight volume, the share of the IR in their transport has reduced over the years.
- For example, coal consumption was 602 and 978 million tonnes (MT) in 2011 and 2020 respectively while the rail transport share was 420 and 587 MT respectively; the rail share fell from around to 70% to 60% in a ten-year period. Though it improved to 64% in 2023 it is still lower than what it was in 2011.
Exim containers:
- Similarly, the share of exim containers moving in and out of ports hovered between 10% and 18% since its introduction in 2009-10, with the 2021-22 figure being 13%.
- The private container train operation policy, initiated in 2006 to boost the rail share of container movement, has not made any significant dent in improving the share.
Index of NTKM:
- Further adding to the woes of the IR is the constantly fluctuating key index of Net Tonne Kilometres (NTKM), which fell for two successive years in 2015-16 and 2016-17 by 4% and 5% over the preceding years, first time such a fall has happened for two consecutive years.
- Demonetisation perhaps had some effect in the fall as NTKM recovered in 2017-18 by 11% registering an increase of 1.6% in the three-year period starting 2015-18.
- However, NTKM continued to fluctuate as it fell again in 2019-20 by 4%. In the seven-year period ending 2021-22, NTKM grew annually at the rate of 3.5% much less than the road transport growth rate.
Developed countries to overshoot carbon emissions goal, says study
(GS paper 3, Environment)
Why in news?
- Recently a study was published by the Delhi-based think tank Council for Energy Environment and Water (CEEW).
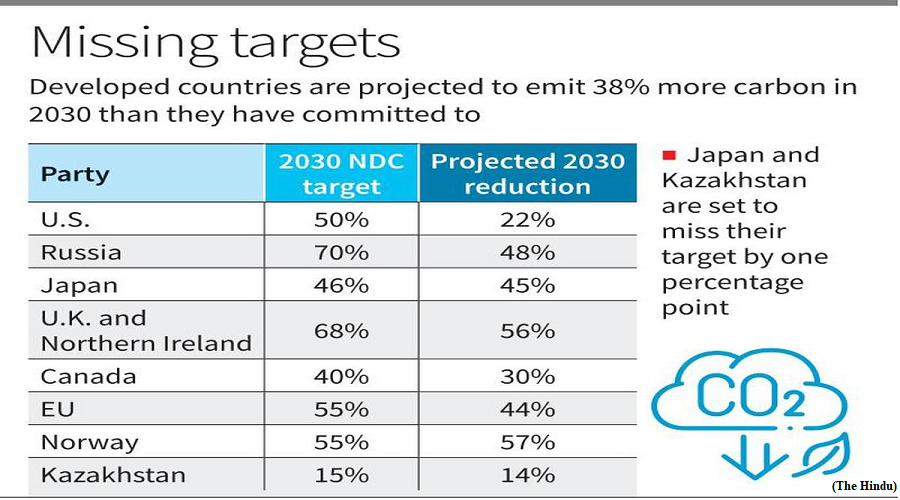
- As per this report, developed countries responsible for three-fourths of existing carbon emissions will end up emitting 38% more carbon in 2030 than they have committed to, going by current trajectories.
- It shows that 83% of this overshoot will be caused by the U.S., Russia, and the European Union.
NDCs:
- The study, which comes ahead of the 28th Conference of Parties (COP-28) of the UN Framework Convention on Climate Change to be held in Dubai in November and December, shows that 83% of this overshoot will be caused by the U.S., Russia, and the European Union.
- At COP-28, countries are expected to give an account of their Nationally Determined Contributions (NDCs), which are their commitments to the UN on emission cuts.
- The study noted that the NDCs of developed countries already fall short of the global average reduction of emissions to 43% below 2019 levels that is needed to keep temperatures from rising above 1.5 degrees Celsius. Instead, developed countries’ collective NDCs only amount to a 36% cut.
Reducing emissions:
- For a fighting chance at keeping warming below critical tipping points, decades of negotiations have obliged developed countries to lead global efforts to reduce greenhouse gas emissions with legally binding targets.
- Collectively, developed countries were to reduce emissions by 5% from their 1990 levels between 2008 and 2012, and by 18% during 2013 to 2020.
- Several countries have committed to achieving net zero carbon emissions by 2050. Doing so would require steady measurable cuts every decade until that year.
Key observations:
- As an intermediate objective, countries presented data to the UN on their projected cuts until 2030. To keep temperatures below 1.5 degrees Celsius, developed countries need to cut emissions to 43% below their 2019 level.
- However, the CEEW study found that based on their current emissions trajectories, their cuts would likely amount to only 11% by 2030.
- Except for two countries, Belarus and Norway none of the developed countries seem to be on the path to meet their 2030 targets, though Japan and Kazakhastan are close, and are expected to miss their targets by only a single percentage point.
Was Turkiye earthquake due to interrupted chat between fault lines?
(GS paper 1, Geography)
Why in news?
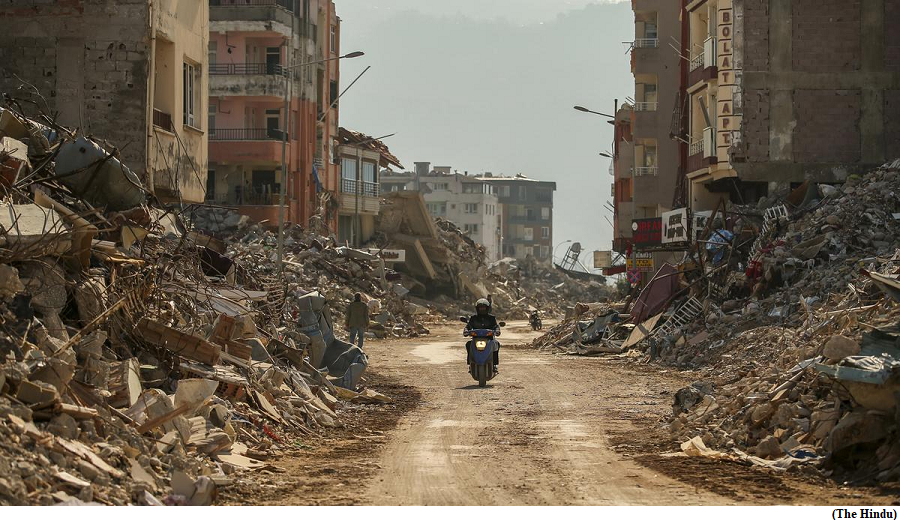
- On February 6, 2023, a pair of powerful earthquakes struck Turkiye and Syria, leaving destruction in their wake. The earthquakes weren’t entirely unexpected given Turkey’s seismic history, but scientists were startled by their unprecedented scale.
- A study unearthed the intricate union of tectonic forces that led to the disaster, advancing researchers’ understanding of these quakes, their unexpected power, and what they portend for the way scientists are trying to forecast others like them.
How earthquakes occur?
- The earth’s crust consists of tectonic plates. Fault lines form where these plates interact, as they collide, pull apart or slide past each other. When these plates abruptly grind and slip past each other, they release pent-up pressure, leading to earthquakes.
- The earthquakes in Turkey occurred along the East and North Anatolian Fault Lines, which run 700 km and 1,500 km long, respectively. And these geological behemoths, the new study found, were in constant dialogue.
- A seismic “cascade” broke through fault bends and step-overs, which are otherwise barriers to the propagation of an earthquake.
- Fault bends and step-overs are like curves and gaps in a road. For earthquakes, they are places where fault lines change direction or have a little gap. They affect how and where earthquakes happen.
Series of ruptures:
- The unusual interaction initiated a cascade of ruptures, resulting in a larger-than-usual total rupture length and a more tremendous potential for destruction. A testament to this is the fact that, in places where there were no buildings and/or where no people died, scientists observed craters after the earthquakes.
- The first earthquake (M7.8) struck near Gaziantep on a strike-slip fault, a type of tectonic plate boundary where two plates slide horizontally past each other.
- The next quake (M7.7) hit near Ekinözü, roughly 200 km north. They were Turkiye’s strongest in more than 2,000 years and caused substantial damage along the East Anatolian Fault, which runs through eastern Turkiye, extending from near Turkiye’s border with Syria to the northeastern region.
- The Narlı Fault and Çardak–Sürgü Fault Zone are also primarily located in eastern Turkiye. They extend from the southern part of Turkiye to the northeastern part, roughly parallel to the border with Armenia. They both experienced separate earthquakes.
- The ground near the coast some 200 km to the southwest began to move like a liquid. The Cyprian geological survey department recorded a minor tsunami near the island in the eastern Mediterranean Sea.
Comparative analysis:
- Researchers received satellite data nine hours after the earthquake. While some researchers compared the 2023 quakes to historical records and GPS data to make sense of the numbers, they also used supercomputers to run simulations using the available data and compared them to GPS data and images of the earth before and after the events.
- Their work in Science was distinguished by two methods: kinematic slip inversion and fault-property modelling.
- Kinematic slip inversion is like rewinding an earthquake video to understand how fault surfaces moved, indicating what might have occurred underground.
- In fault-property modelling, researchers estimate the characteristics of the fault, like friction and material properties, to predict how an earthquake is likely to spread along it. These predictions are then compared to real earthquake data to gain insights.
Way Forward:
- The lessons from Turkey’s quakes have far-reaching implications. They were revelations of the planet’s oft-enigmatic inner workings, underscoring the unpredictable nature of seismic events.
- Then again, Turkey had been aware of the possibility of such an earthquake. Turkish law requires its buildings to adhere to building codes designed to prevent the sort of disaster following the events of February 6.